

We all want our data to be perfect: anyone from an individual, filing tax forms to a CDO of top tier company. But what is 'perfect data'? Everyone has their own and maybe quite a thorough view depending on their role and experience. In this article, I want to discuss this issue from a data scientist's perspective but in plain English.
What is perfect data
Just like mathematicians, data scientists like to formalise and model things. So I'll start from a formal definition: 'Perfect data' is data that entirely fits the intended purpose. Like any formal definition, it lacks colour, but that's how sciences work. Theories are always bland, and its interpretations and applications what makes them shine. So let's do a bit of formality and then add colour.
Thus, 'perfect data' can only be defined in conjunction with a purpose. It means there is no abstract 'perfect data'; there is only data perfect for something. Because in enterprise data management domain, data has many uses, there is no such thing as 'perfect' enterprise data as a whole. It can only exist locally, for some very particular purpose.
Perfect data in real life
Now, let's see if the 'perfect data' is achievable locally in the enterprise data domain. For that, we first need to focus on a single purpose. It could be anything, for example, automated customer billing. Not all data is useful for this purpose. In this example, we would probably be looking into customer contract data, sales, customer account balance and contact details.
In an ideal world, this system would work precisely, consuming and producing "perfect" data. But we all know, such data is hard to find in real life. Otherwise, the Enterprise Data Quality market wouldn't grow 17% each year. Real data always have some flaws that make it imperfect. This fact can be written in a symbolic formula:
In this symbolic language, the goal of Enterprise data quality is minimising these data issues. Hypothetically, when data issues reduced to zero, real data becomes perfect. But that's obvious and isn't very useful. It becomes useful when we look into data issues closely.
If we hypothetically had a list of all possible issues with the data and their frequencies of occurrence we could make a bar chart that would look like this:
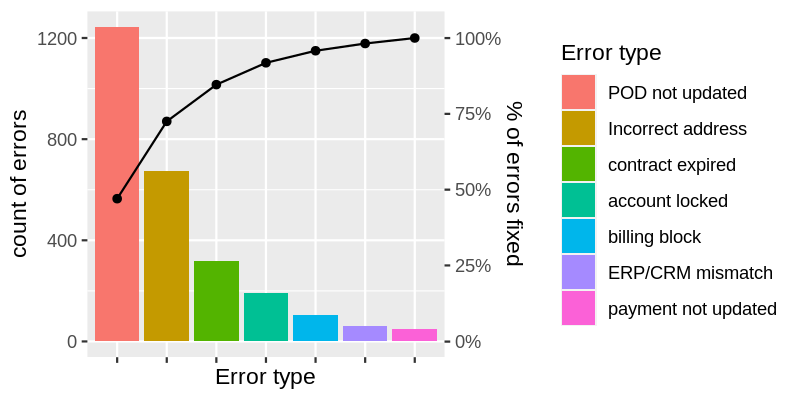
In reality, there will be much more possible error types, 10s or 100s. In this case, error frequency distribution will look like this:
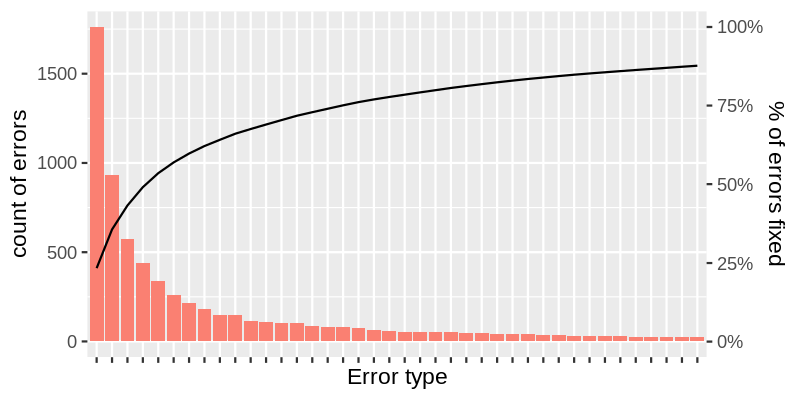
Looks familiar? It is a famous plot shape that appears in many fields from social sciences to manufacturing when some events are counted. Its name is Pareto distribution, and it is well known in Quality Control, and it is also known for the Pareto principle or the 80/20 rule.
The Pareto principle
The 80/20 principle is an empirical rule that found working well in many areas. According to this rule, roughly 20% of the top problems are responsible for about 80% of all errors in your data. It means fixing all top ones will eliminate 80% of all errors. But that also means you will have to rectify the rest 80% of problems to make your data perfect.
If each error type takes the same effort to get fixed, or if you use average effort-per-issue, you can build an "effort-result" curve, which is shown as the black line on the above plot. On the left, the result grows fast, and the outcome from efforts spent is maximal. The curve starts to flatten very quickly, pushing the result-per-effort ratio to almost 0 as you pass the 80% level.
The price of perfect data
The plot above shows that fixing the last 10-20% of errors in data will require enormous efforts. These errors will all be coming from a large number of odd non-related small problems that need a separate fix for each.
Any business owner would ask a question here: how much this 10% of errors cost in losses? Is it worth fixing it? Maybe we should live with them and keep the data at 'good enough' level? In other words: do we really need perfect data? Perhaps we can live with good enough data because it is much cheaper?
Every business asks this question and defines its level of acceptable data quality. These levels can be different for data within the same organisation. For example, legal or regulatory requirements may push this level very high for some particular datasets. On the other side, some non-essential data may be very buggy.
But regardless of business or data specifics, one thing always remains true: a perfect data is just not economical to achieve and maintain.
We are making perfect data affordable
Perfect data is costly because the data issue discovery process and data repair are not automated. Each error type still requires manual investigation by data analysts. Fixing each data type still needs putting business rules specific to each problem into business applications.
The other problem of modern Data Quality is that it is inherently reactive. All top Data Quality tools are rule-based, which means that analysts must know what to look for to make rules for such systems. The main route of all issues to become known is still incidents that they cause. It means that any dataset most likely contains errors not yet known to its business owners .
Our solution implements a revolutionary new approach that makes both issue discovery and issue fixing fully automatic. In it, we have removed human knowledge and experience from the list of dependencies for implementing a Data Quality system.
By automating issue discovery, our solution also enables truly proactive issue discovery.